The Explore Interface
A map of the main screen and the controls available while exploring a universe.
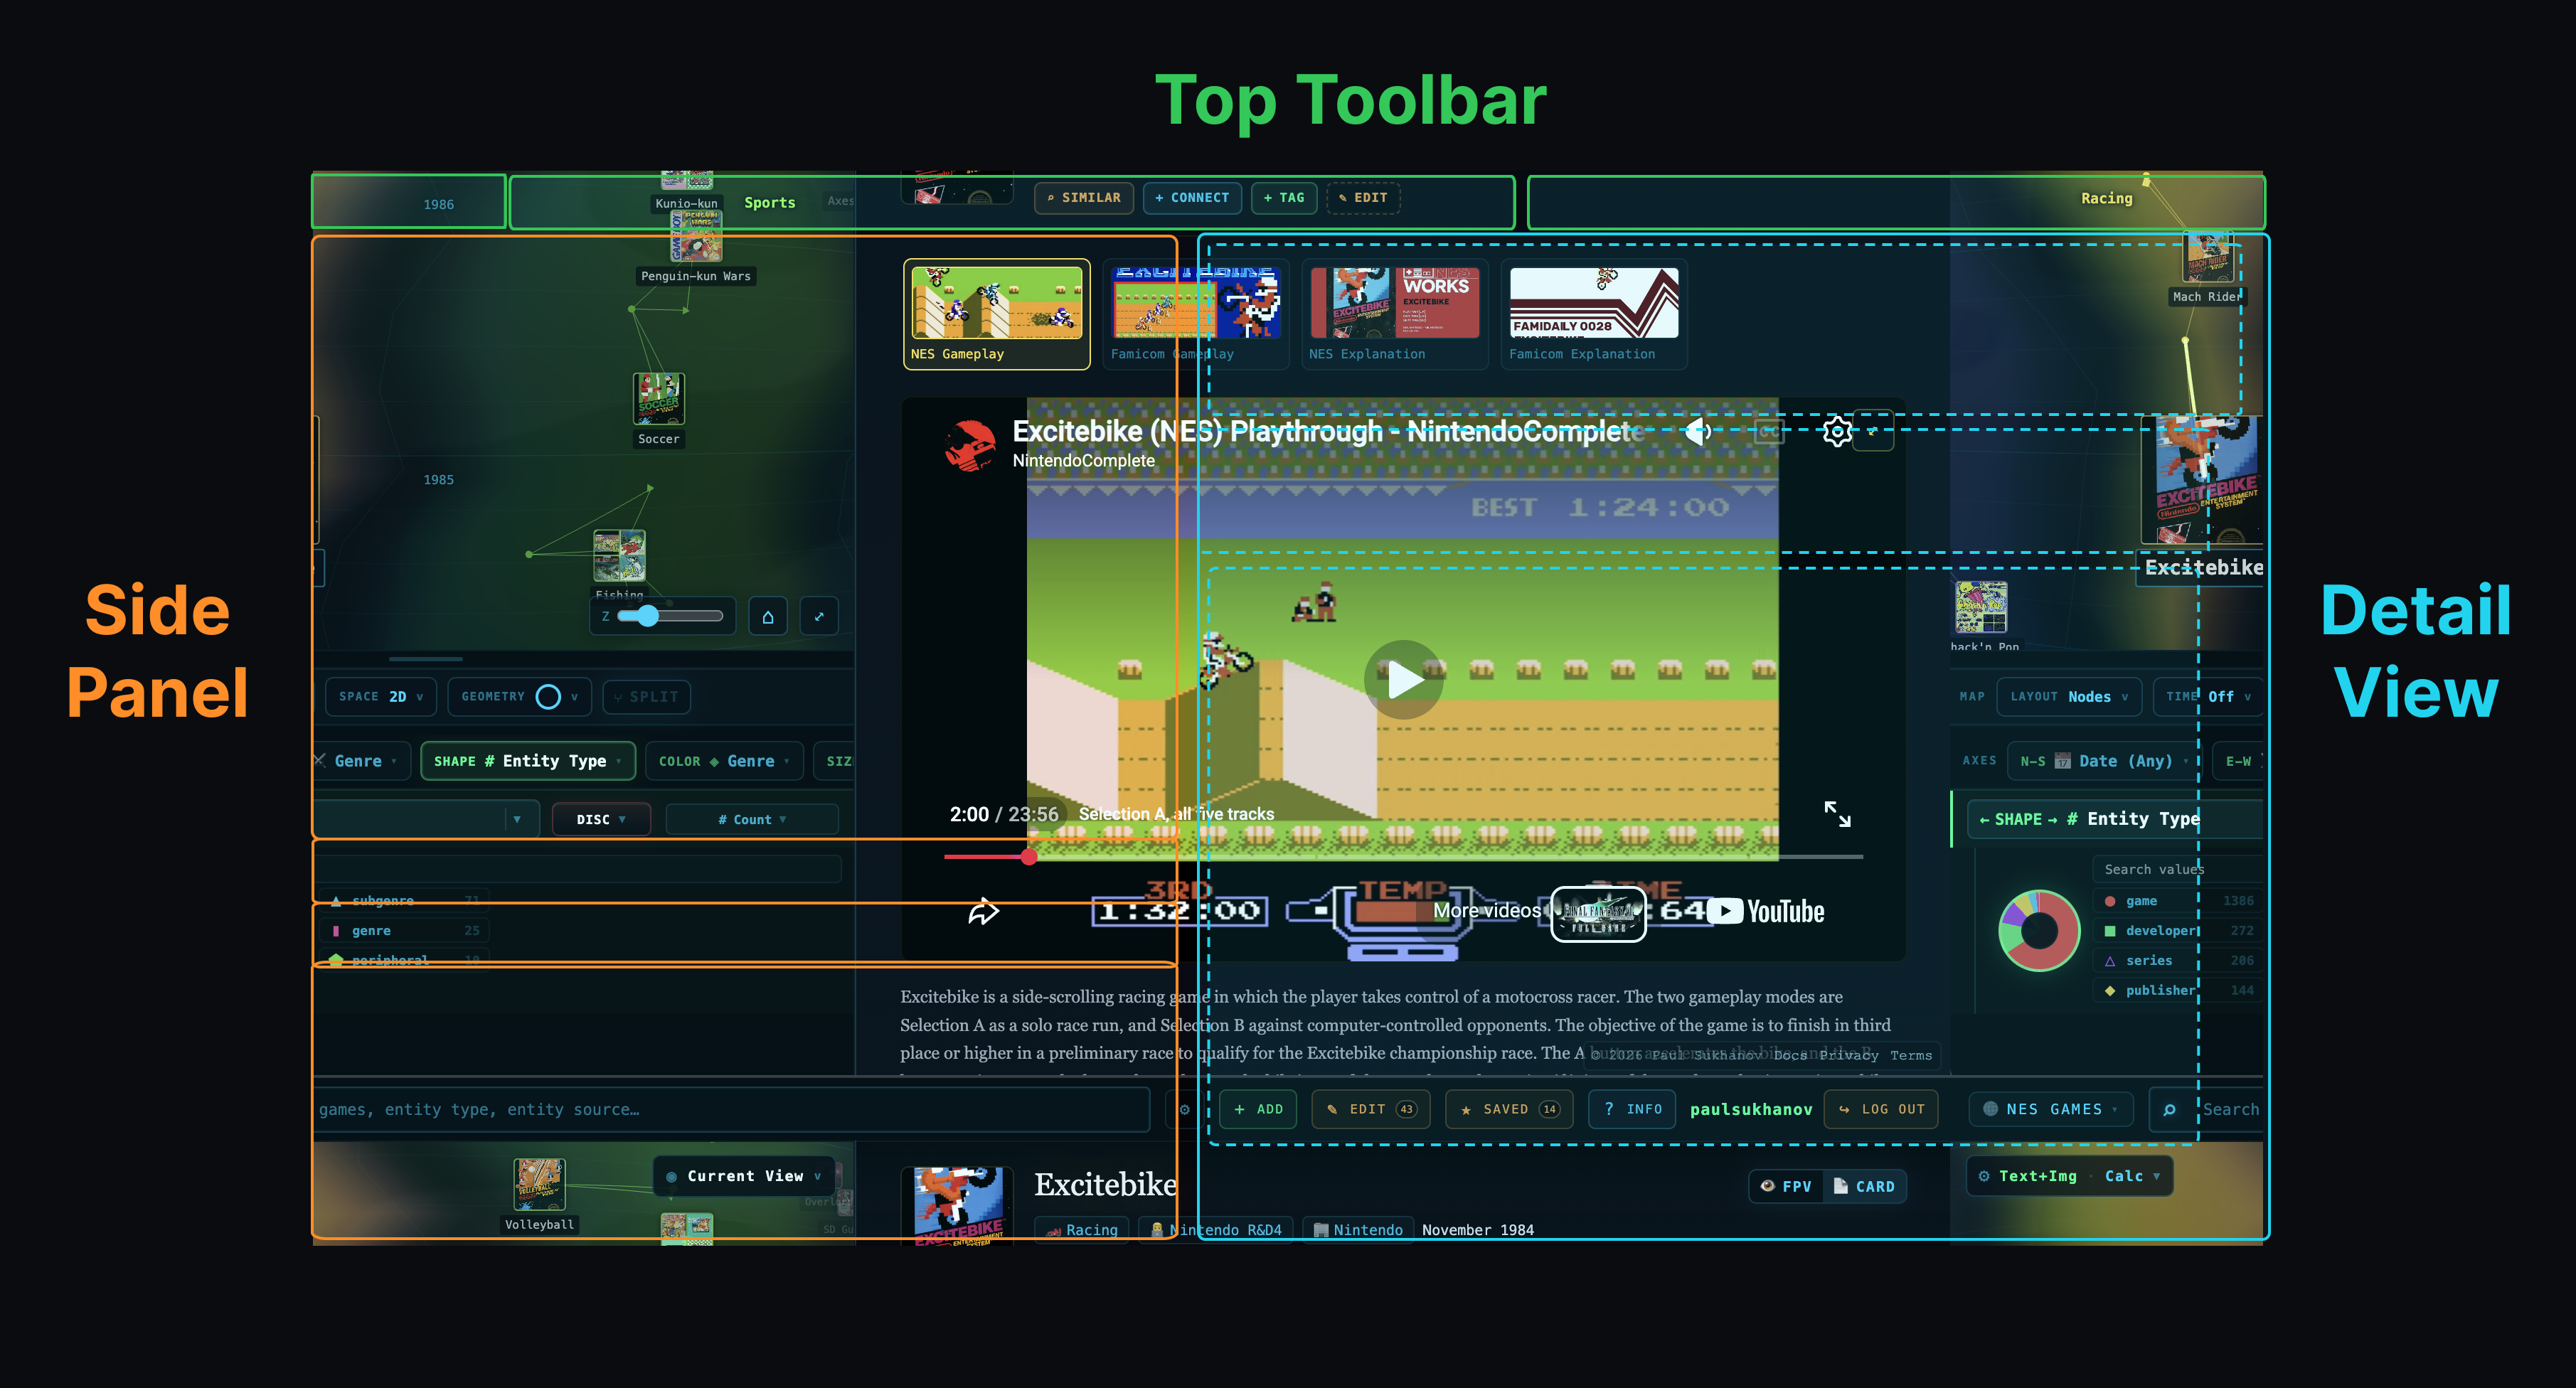
Top bar
Section titled “Top bar”
The top bar contains the universe picker, search & active filters, and toolbar actions.
Universe Picker
Section titled “Universe Picker” Click here to select a different universe (ie; dataset) to go to, or to create a new one.
Search Bar
Section titled “Search Bar”
- Click in the search bar to see suggested searches
- Type to filter the suggested list based on your input text
- Clicking on a suggested result will navigate to that node.
- Hit
enteror click “Apply” to perform a semantic search using the entered text. See Searching and Filtering for more details and for other ways to search.
Toolbar Actions
Section titled “Toolbar Actions” You can use one of these buttons to easily
- add more data to the universe
- bulk edit nodes or edges
- view saved data, such as routes or collections
- see an overview of the navigation controls
Side Panel
Section titled “Side Panel”The side panel combines a map preview with controls that shape the visualization.
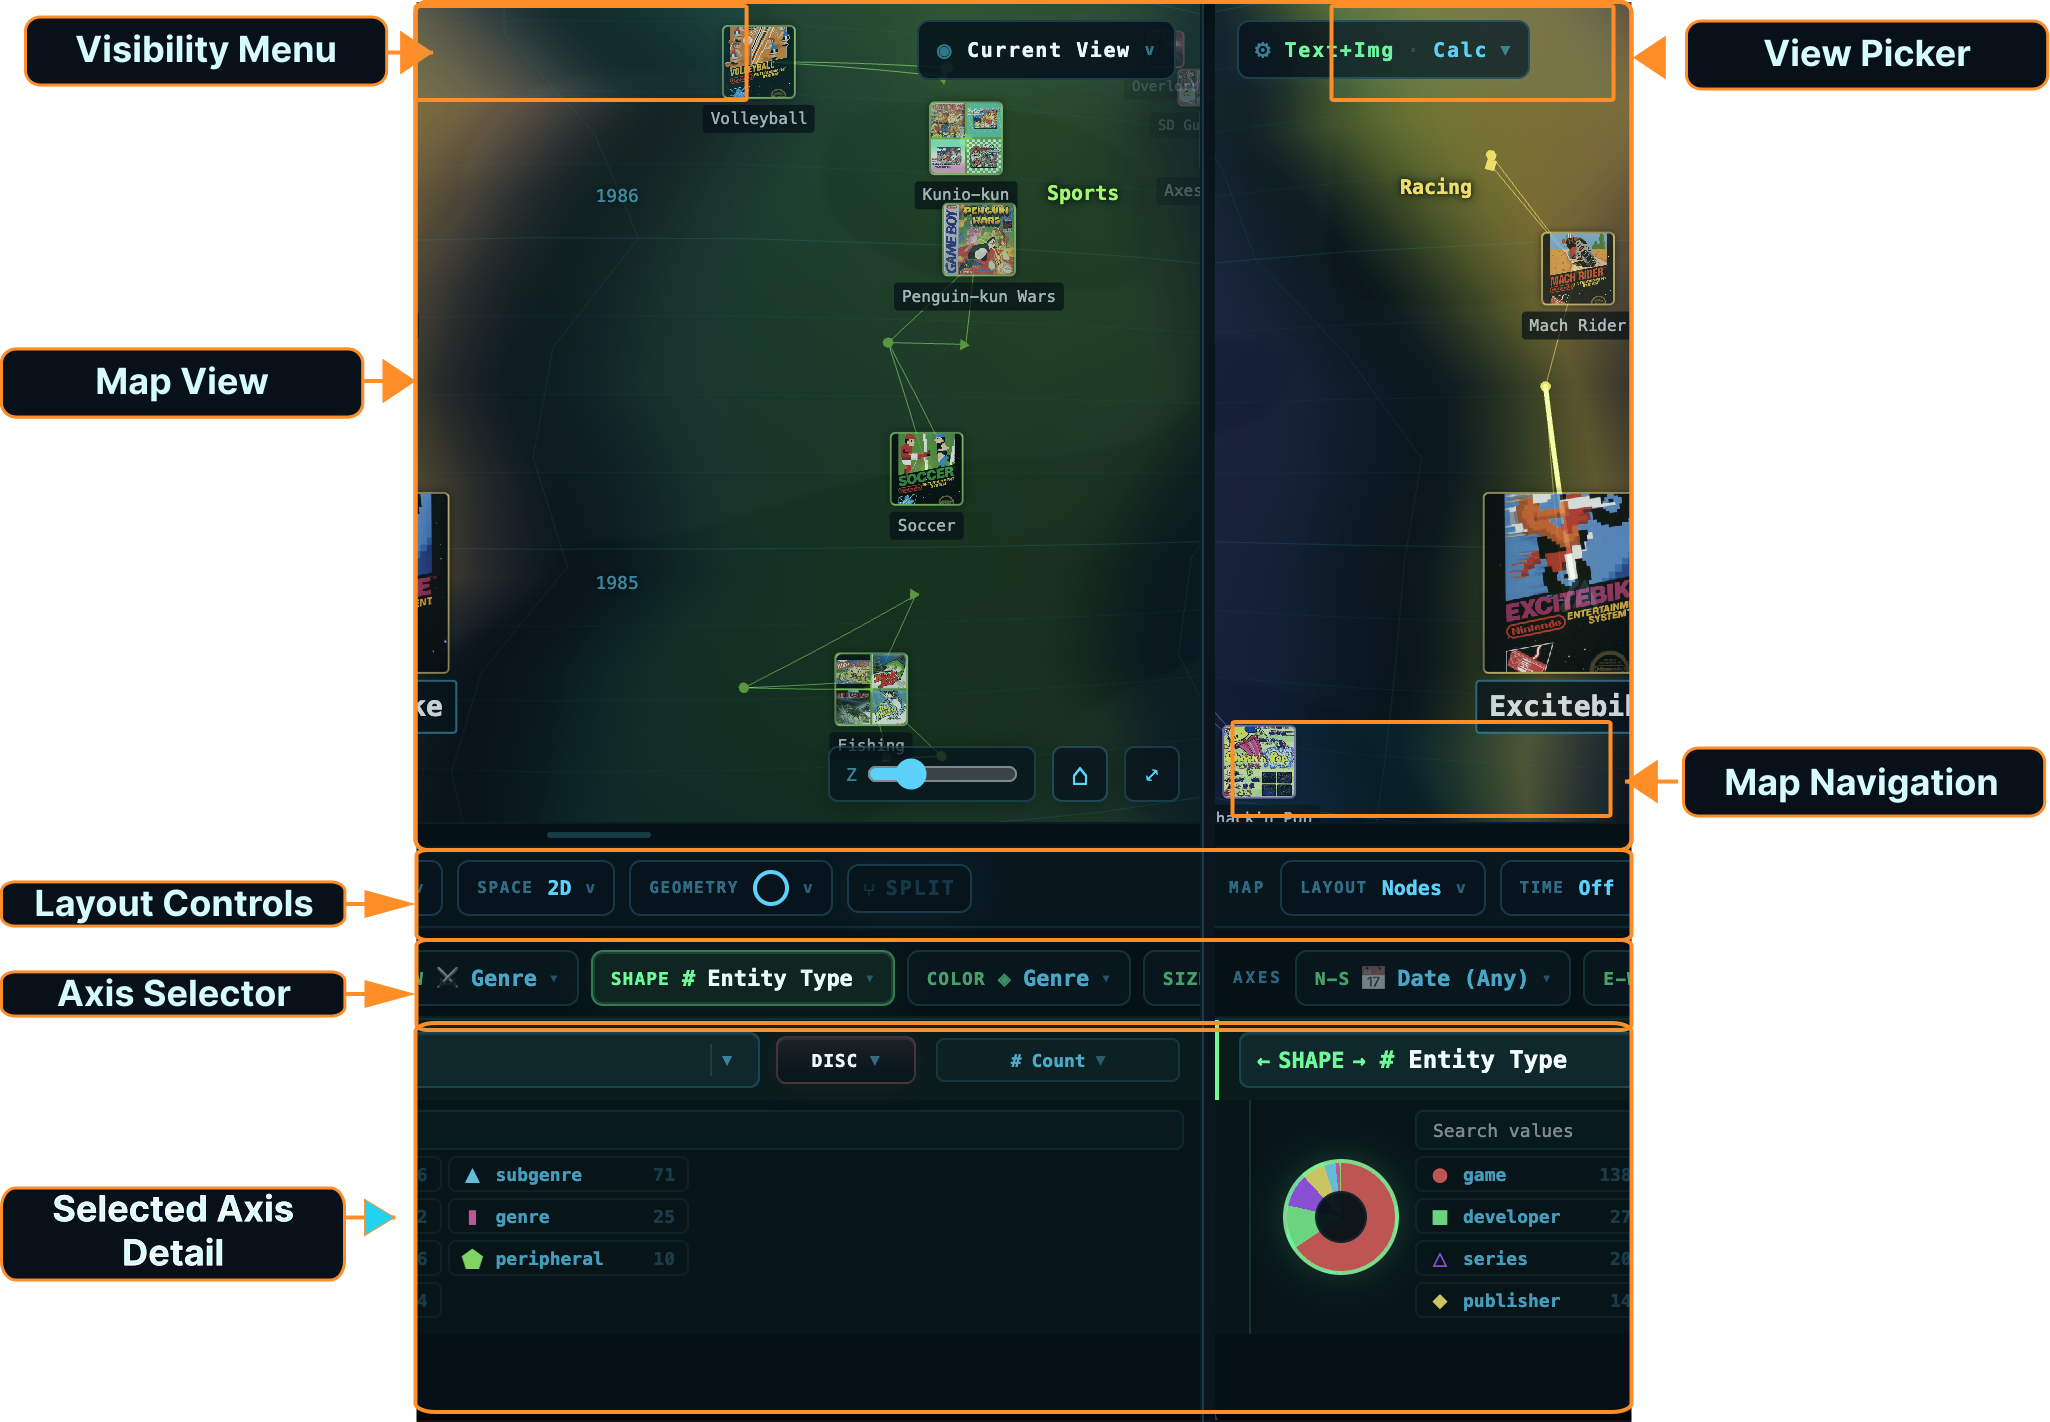
- Map View: plots nodes and links on a map
- Visibility Controls: Controls visibility of links and node labels
- Map Navigation Controls: Navigation shortcuts
- Layout Controls: Determines what axes to map on and the layout strategy for placing nodes and edges.
- Axis Picker: Shows what axes are available, and what variables are currently mapped to those axes.
- Selected Axis Detail: Shows details about the data distribution for the selected variable, as well as options to select a new variable(s), project the variable, and more.
Map View
Section titled “Map View”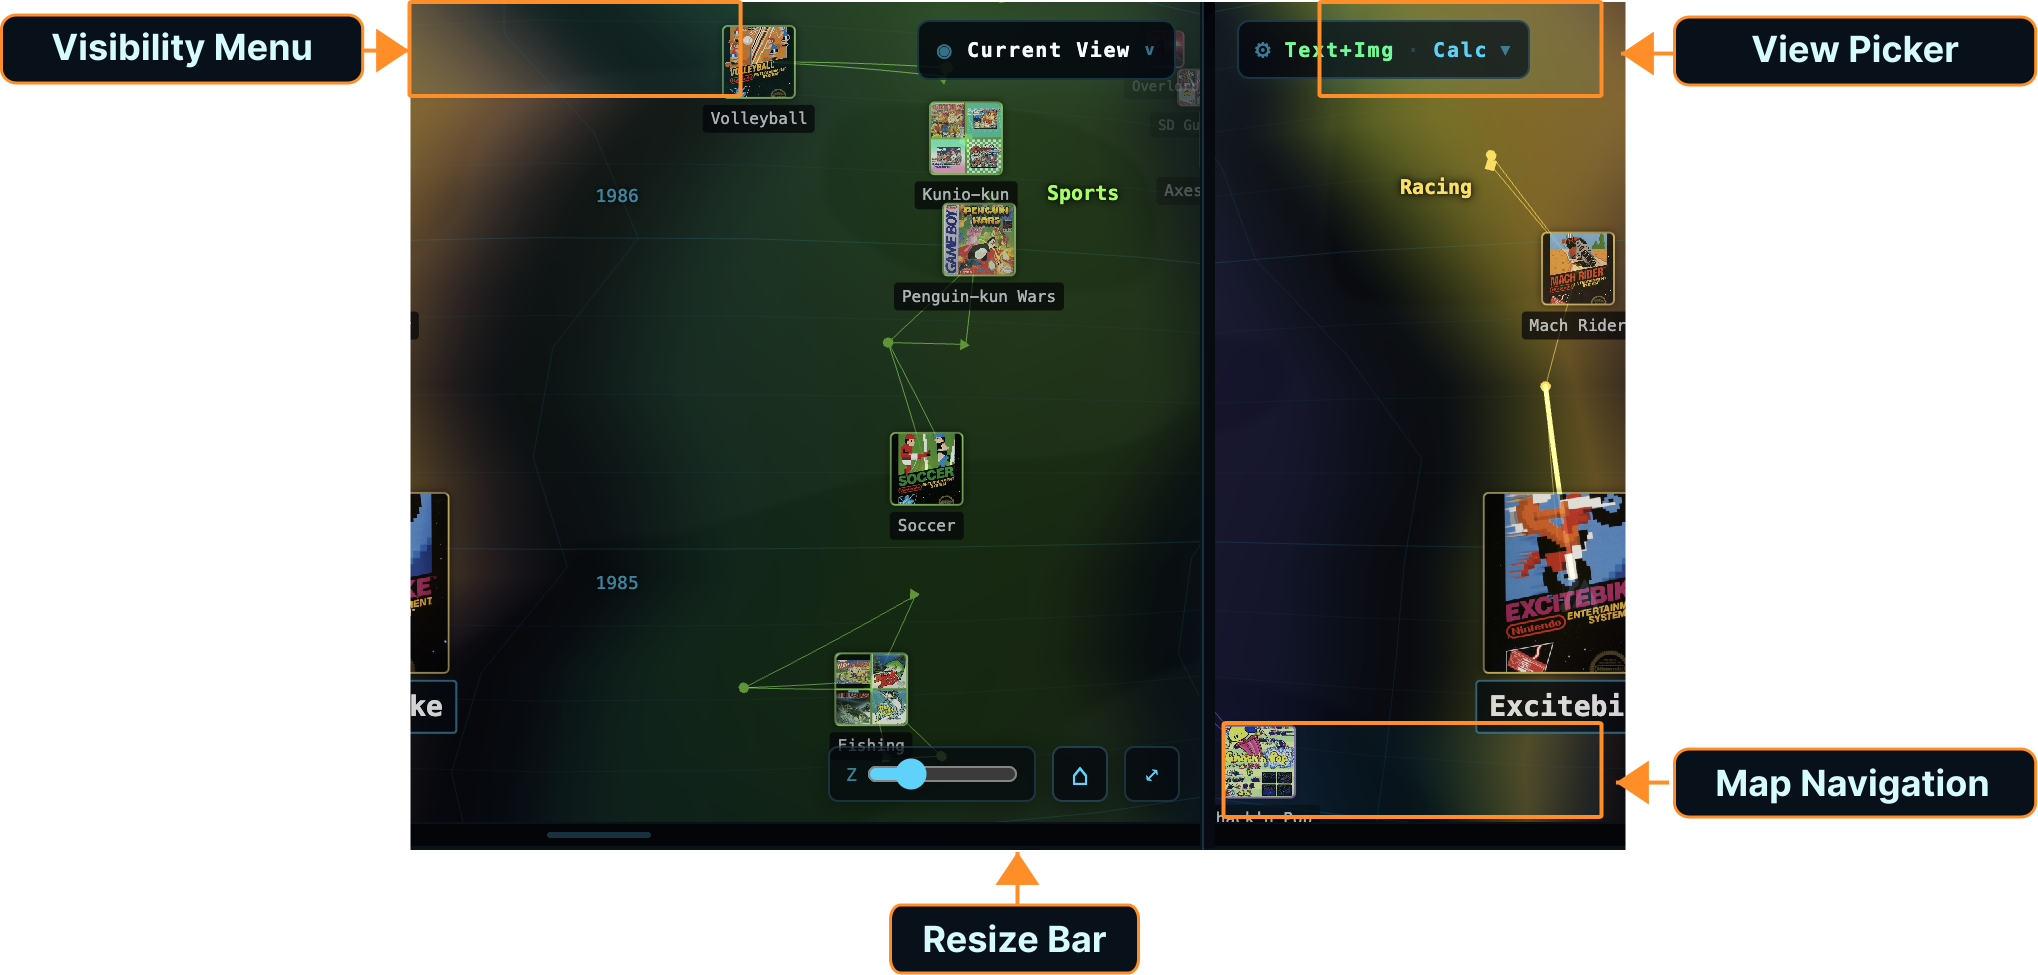
- Your data is visualized on the map view using the configuration set in the Layout Controls.
- Click and drag to move the portion of the map that is visible.
- Pinch, scroll or use the “Z” slider to zoom in or out.
- Hover over a node, edge, or cluster of nodes to see a small preview of the content (when zoomed out, only clusters will show previews)
- Click on a node cluster, individual node or link to view information about it in the Detail View
- Hold Cmd + click + drag to multi-select nodes using a rectangular selection tool.
Visibility Menu
Section titled “Visibility Menu”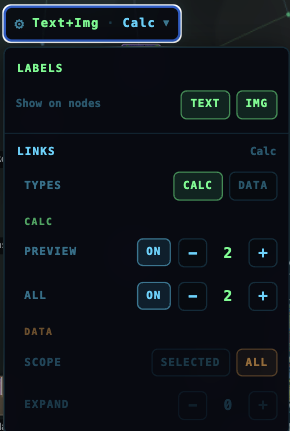 The visibility menu controls what aspects of the node and edge data are visible.
- Most nodes will have a text label and an image preview of some sort, you can show/hide either with the options in the “Labels” section.
- There are two types of “Links” and you can control visibility of either in the “Links” section.
- “Calc(ulated)” links show nearest distance between nodes according to the map.
- “Data” links show links that are defined in the data itself, regardless of how the map was constructed. Show/hide either set completely by toggling the “Calc/Data” buttons.
- If “Calc” links are enabled, you can also configure how many nearest neighbor nodes you want to see, and can set this separately for the neighborhood around the hovered/selected node (“Preview”) and around any other node on the map (“All”). So, if you set “Preview” to 4 and “All” to 2, you would see links to the four nearest neighbors whenever you hover or select a node, and links to the two nearest neighbors for all other nodes.
- If “Data” links are enabled, you can likewise choose how many “hops” out from the selected node you want to see the links drawn. So, if there was a
View Picker
Section titled “View Picker”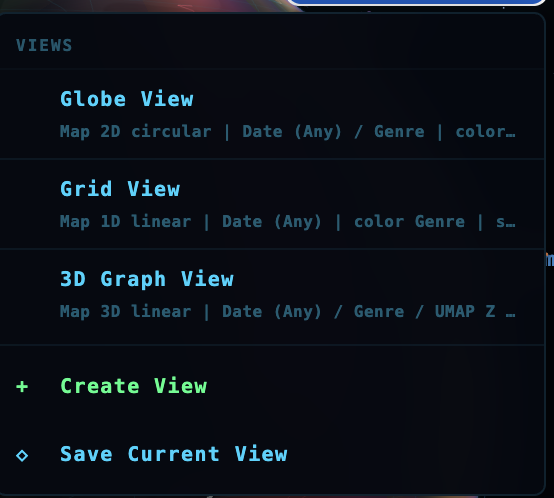 The View Picker lets you easily navigate to a default view, save a view to return to later, or create a new view.
Map Navigation
Section titled “Map Navigation”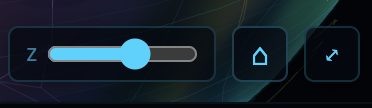
- Slide the slider to zoom in and out in views that support zooming.
- Click the “home” icon to pan the camera to the currently selected area
- Click the “expand” icon to view the map in fullscreen.
Map Layout Controls
Section titled “Map Layout Controls” This set of controls decides what kind of map is calculated and drawn above.
Layout Mode
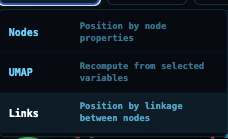 You can select one of three ways to layout your nodes.
- Nodes mode will have you choose some specific properties of each node to use for distance calculation in each axis.
- UMAP mode will allow you to create a combined 1D, 2D, or 3D axis that can incorporate as many properties of each node as you like in order to calculate distance/similarity.
- Links mode will use the defined
Linksbetween nodes as a similarity measure (the more links between two nodes the more similar they are), and use that to run force-directed layout (a small physics simulation where nodes that share links attract each other and those that do not slightly repel each other.)
More details on how maps work here
Time Dimension
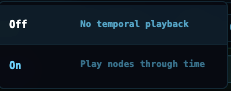 Toggle to add or remove a time axis. A time axis allows you to use some node property to show/hide nodes over time, and allows playback of the state of the map over time.
Spatial Dimensions
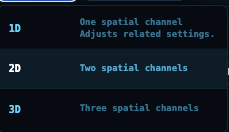 Choose how many spatial axes you want represented in your map (1, 2, or 3)
Geometry
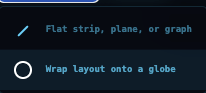 Controls whether the spatial axes proceed forward in a straight line or wrap back around.
Split For data that contains sub-segments that have been extracted by Cronologies (such as chapters in a book, or scenes in a movie), you can choose whether to represent each sub-segment as a node, or the entire content as one node. (In the future this will likely become a “scale” slider, not just a binary option)
Axis Picker
Section titled “Axis Picker”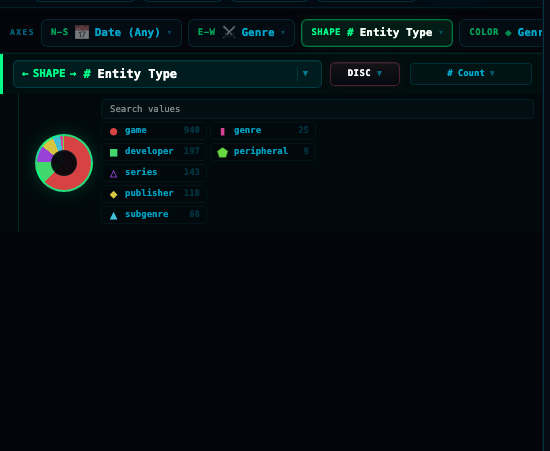 Based on the Map Layout Controls, you will see different things pop up here. Each chip represents either an
 Outer Axis (ie, space or time placement), or an Inner Axis (size, color, shape, etc of each node), and lists what variables are contributing to node placement along that axis.
Switching the layout mode or the dimensionality will update what is shown here. Click on any axis in order to see details about it in the Selected Axis Detail
Selected Axis Details
Section titled “Selected Axis Details” Shows more detailed information about the data distribution for the variable(s) mapped to the selected axis, as well as configuring how the variables are transformed before mapping.
Status and navigation controls
Section titled “Status and navigation controls”The compact navigation controls show the current dimension and value. Use their arrows to move between values, clear the current selection, open search, or display contextual help.
Continue with Visualization Modes or Search & Filtering.